Interface Tour
The Rebind UI runs in your browser at http://localhost:19480. A narrow icon sidebar on the left switches between views.
Scripts
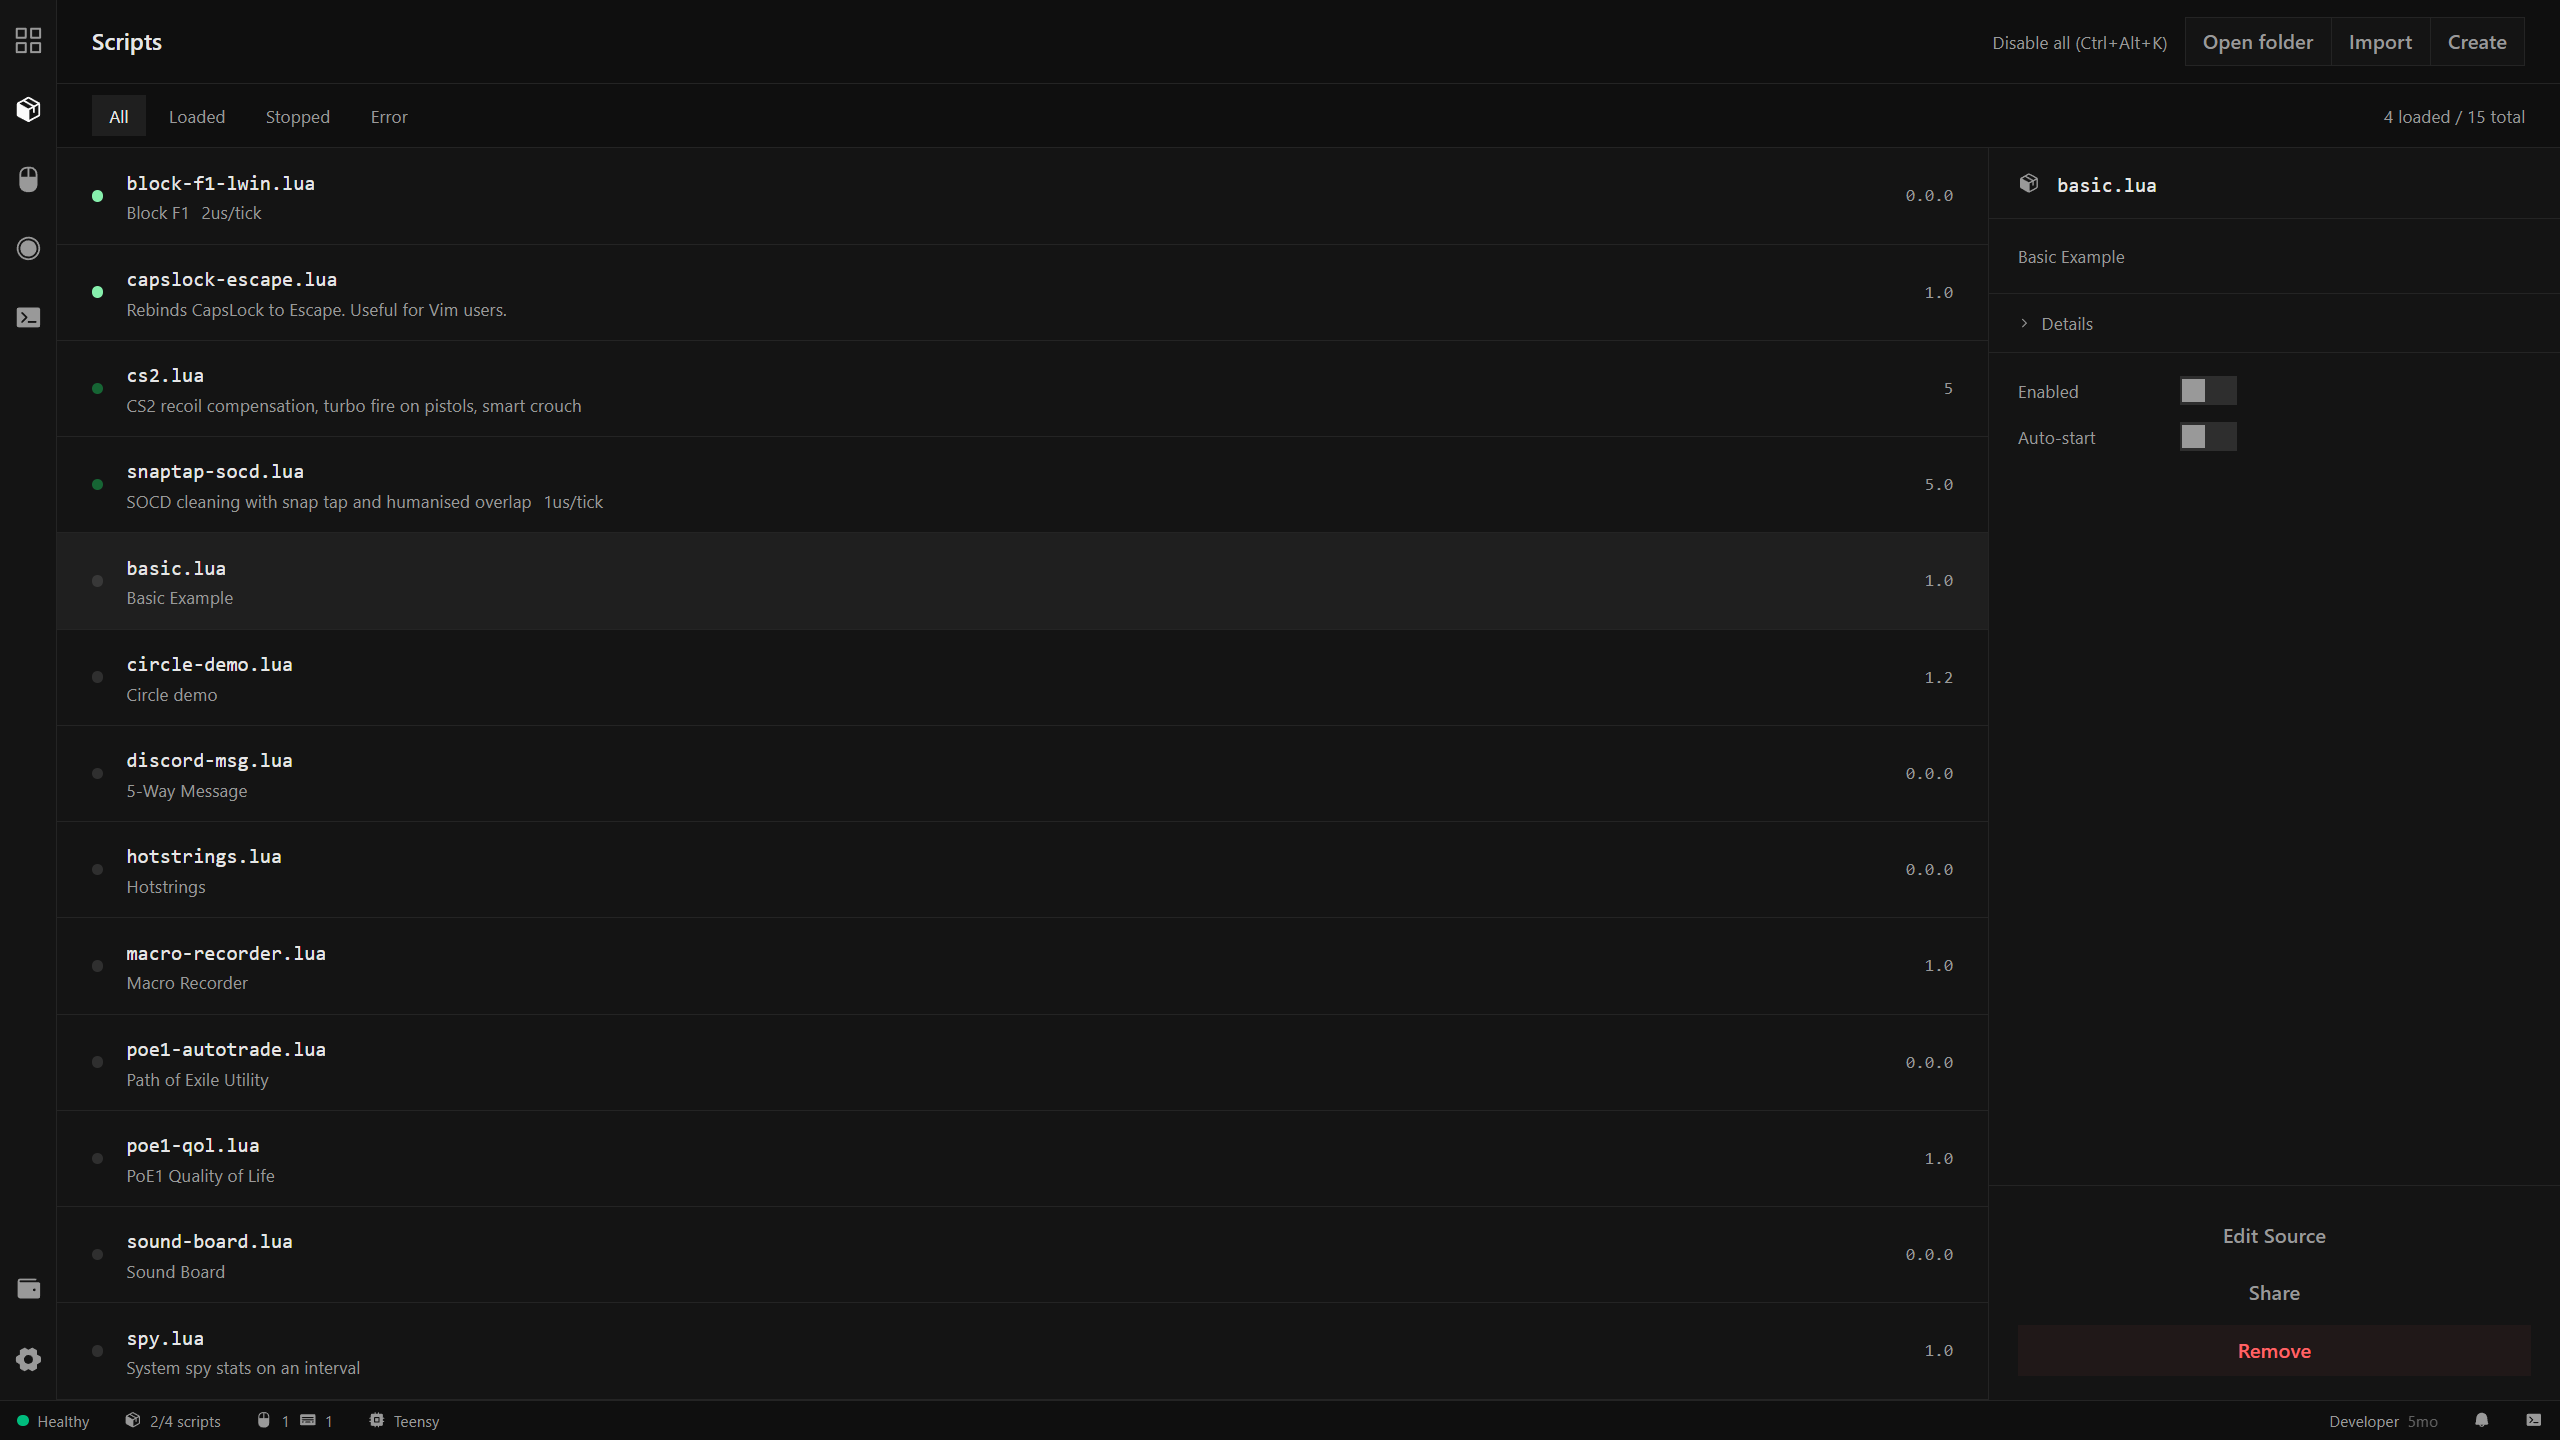
The Scripts view lists every .lua file in your scripts directory. Four filter tabs narrow the list: All, Loaded, Stopped, and Error. A counter in the top right shows how many are loaded out of the total.
Clicking a script opens its detail panel on the right, showing:
- Name and description from the script’s modeline
- Enabled toggle — whether the script is currently running
- Auto-start toggle — whether it loads automatically when Rebind starts
- Edit Source, Share, and Remove actions
The top-right toolbar has Disable all (Ctrl+Alt+K), Open folder, Import, and Create.
Script Editor
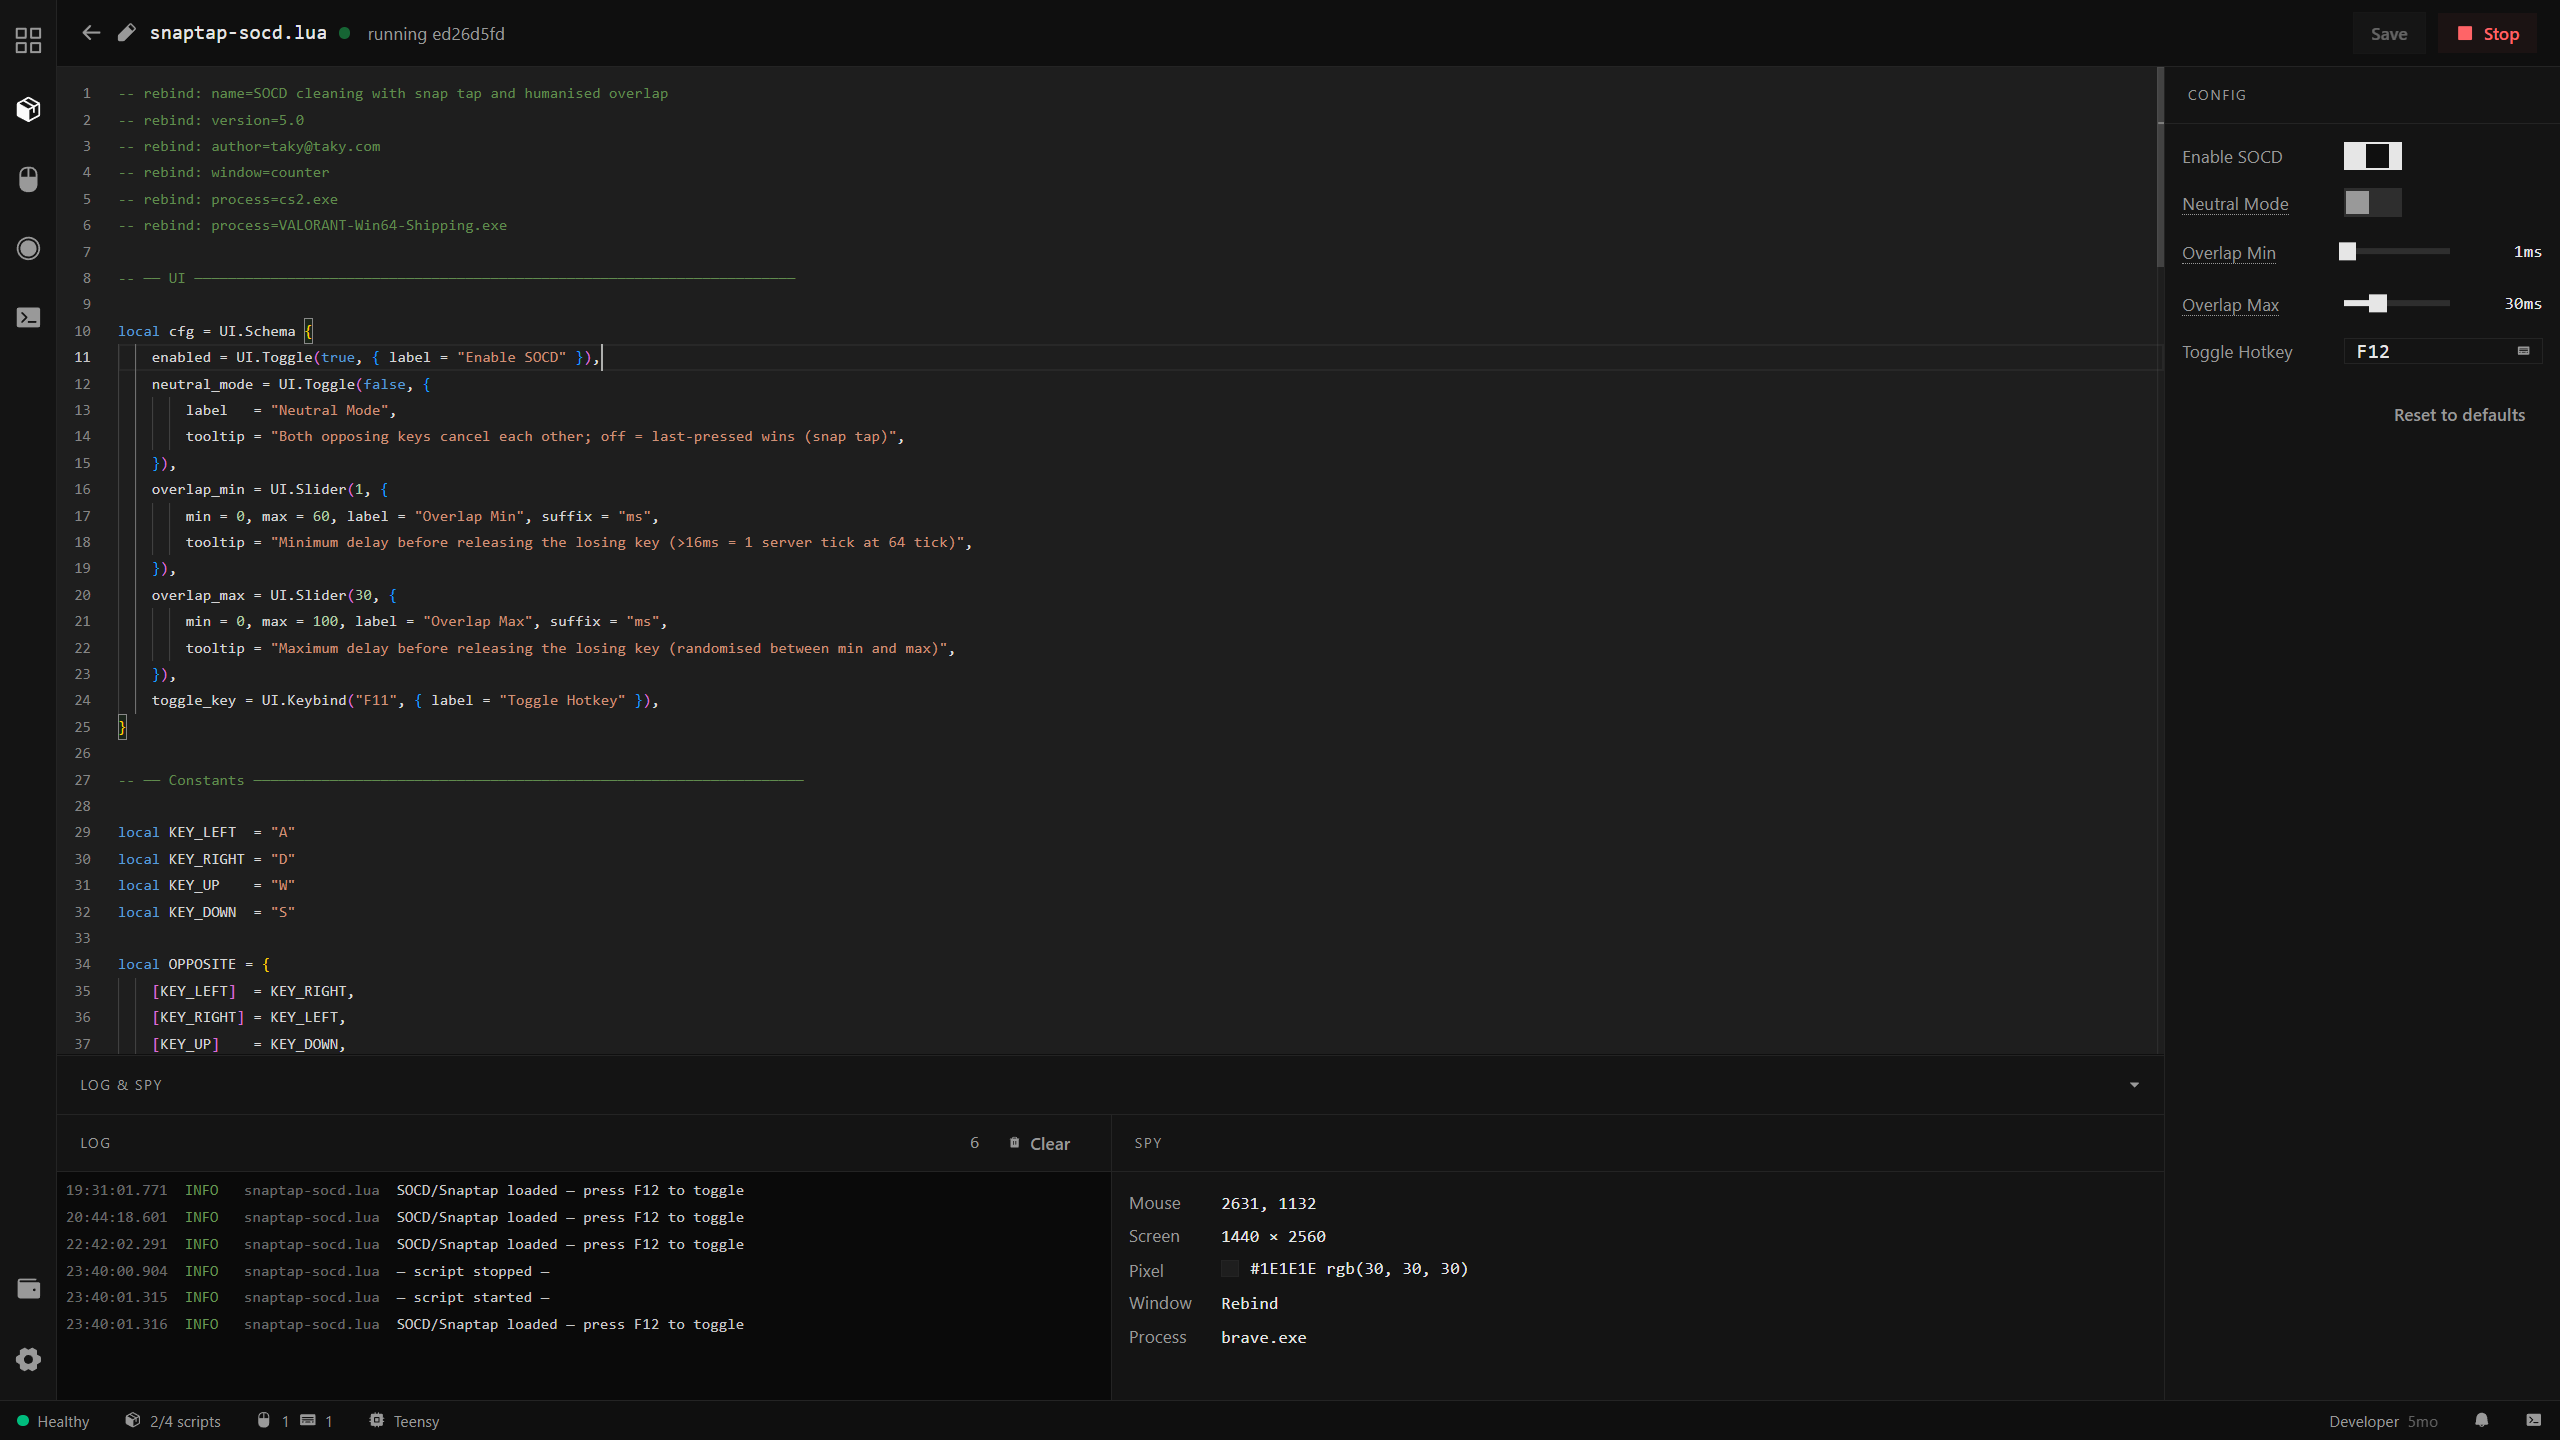
Clicking Edit Source on any script opens the editor. The editor has three regions:
Code panel (left) — a full syntax-highlighted editor. Changes are saved automatically; the dot next to the filename indicates unsaved changes. The running commit hash is shown in the header. Save and Stop controls are in the top-right corner.
CONFIG panel (right) — live controls generated from the script’s UI.Schema. Sliders, toggles, keybind fields, and a Reset to defaults button appear here. Changes take effect immediately without restarting the script.
Bottom panel — split between two tabs:
- LOG — a per-script log stream filtered to this script only. Shows timestamped
INFOentries fromlog(),print(), andLog.*calls. A Clear button and entry count are in the header. - SPY — live inspector showing the current mouse position (screen coordinates), screen resolution, pixel colour under the cursor, the active window title, and the active process name. Useful for writing scripts that target specific windows or read screen state.
Devices
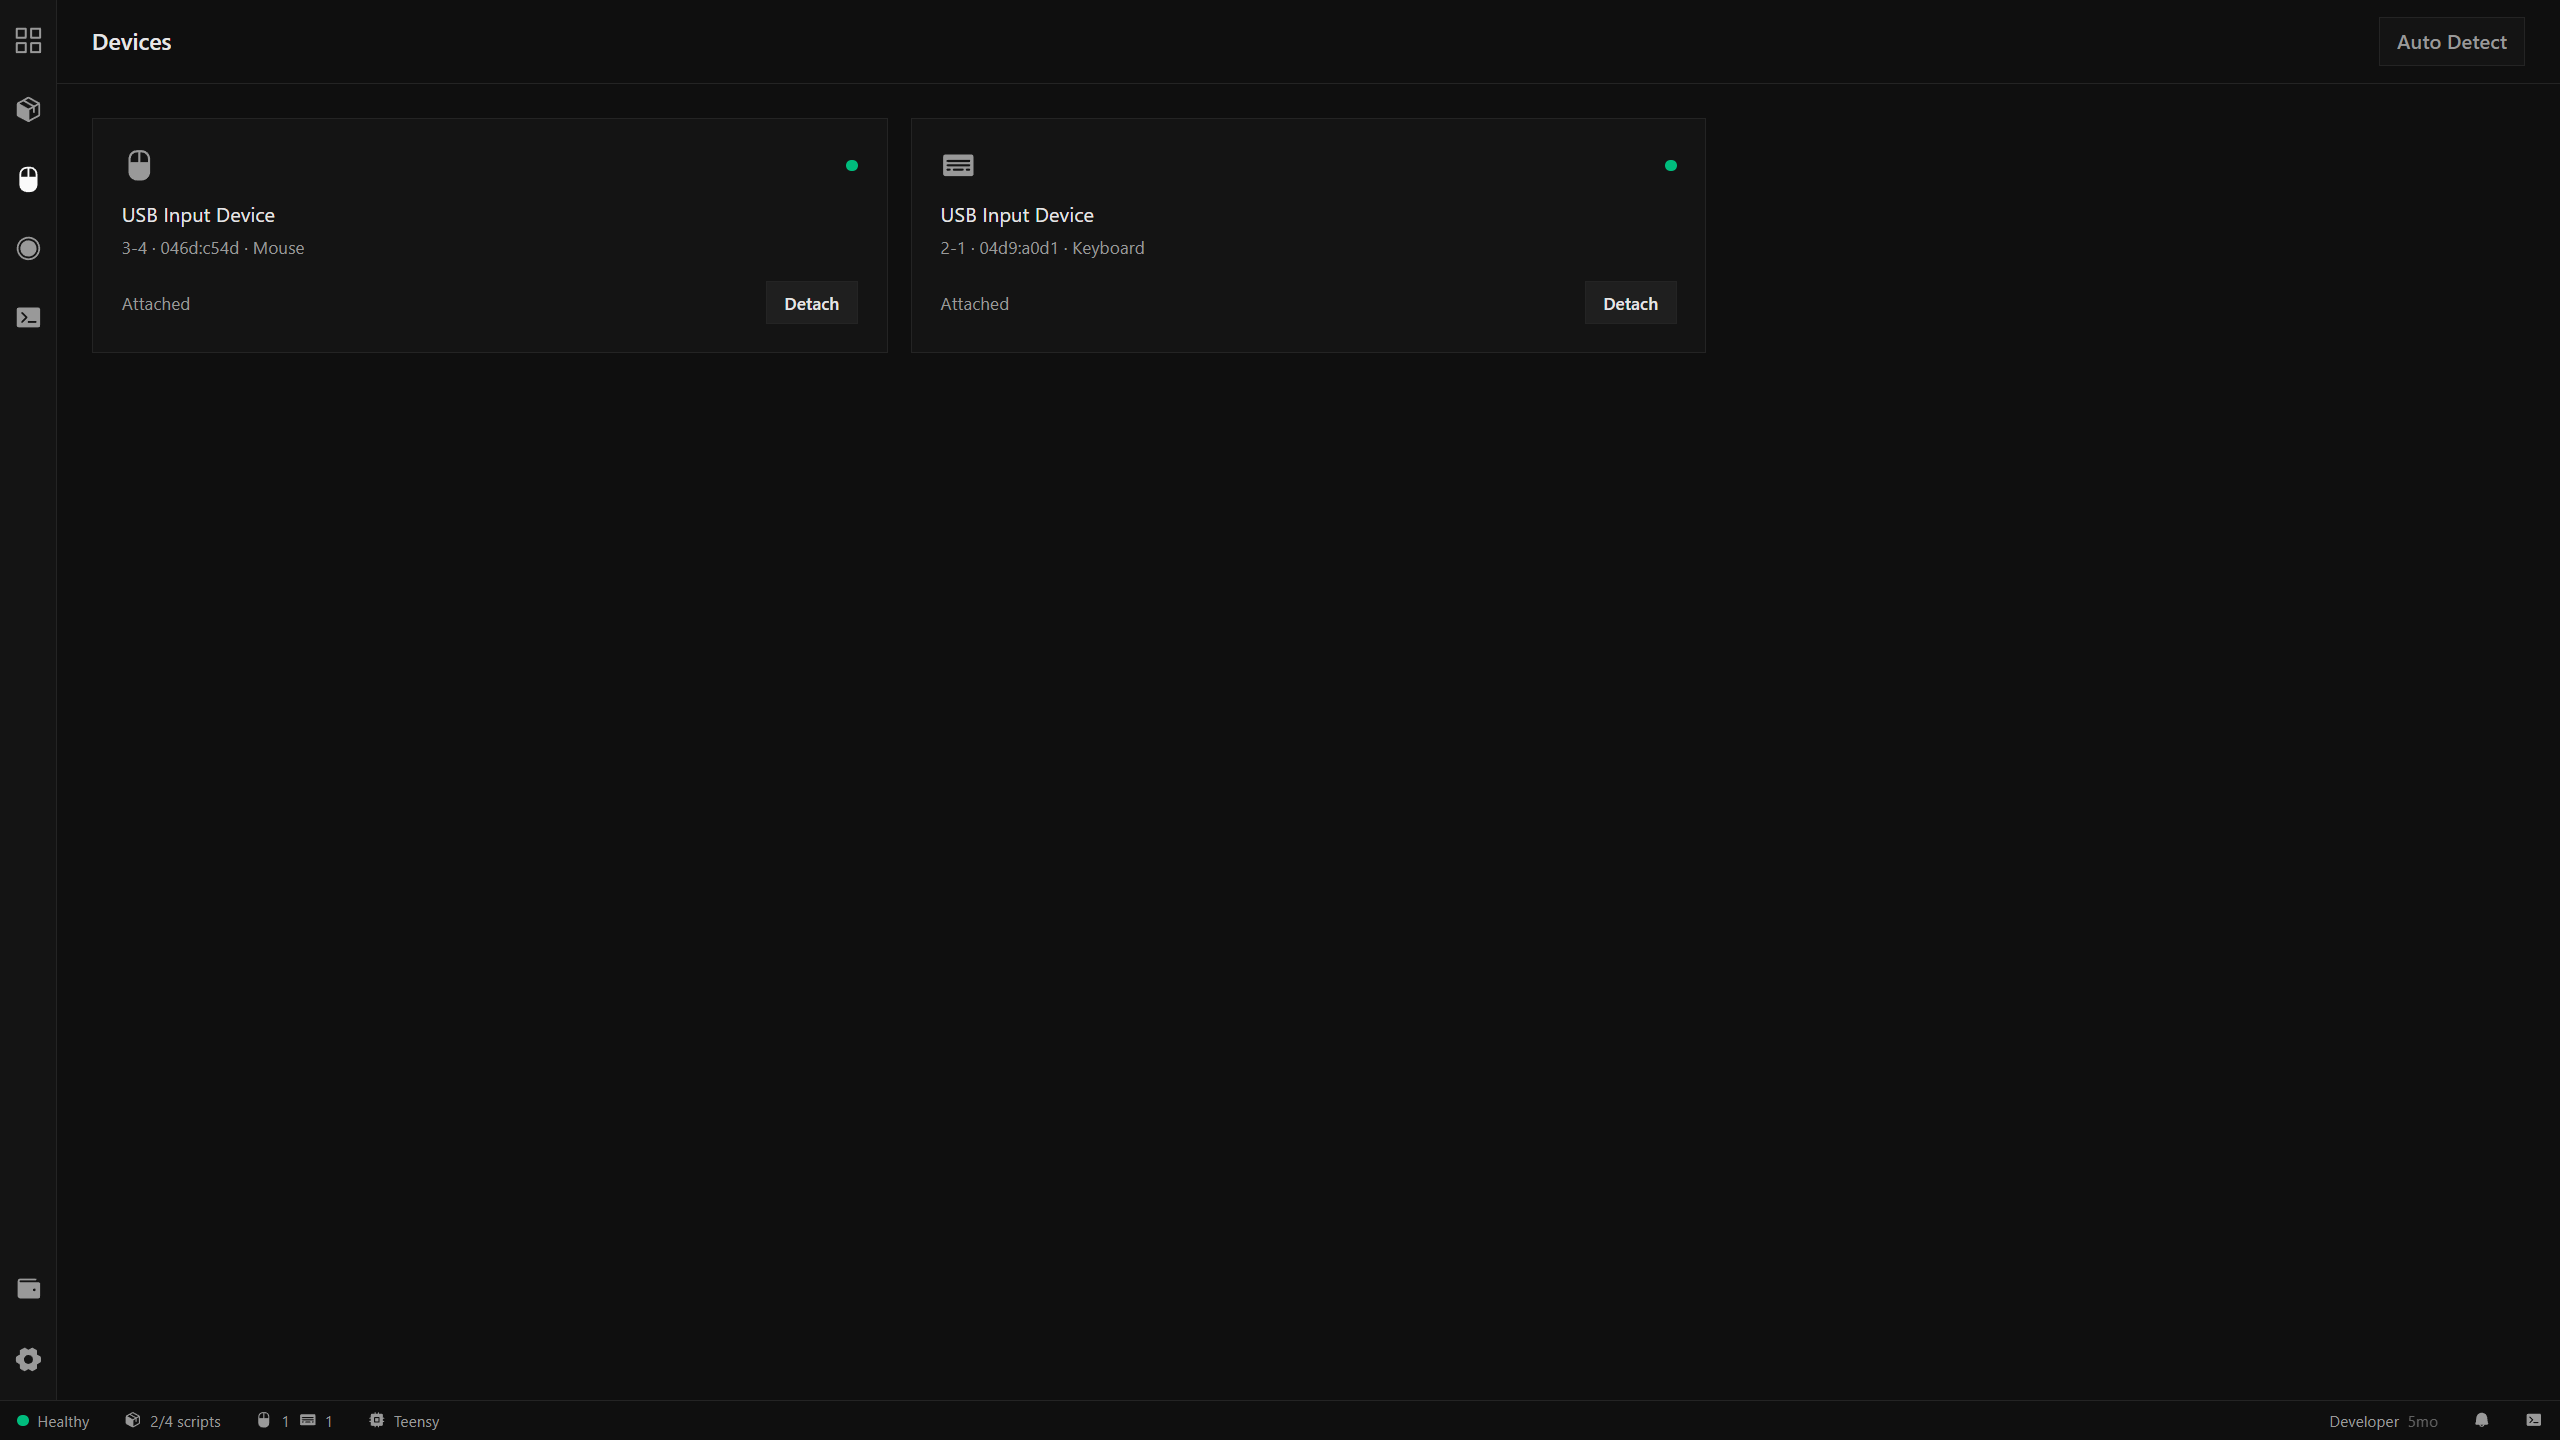
The Devices view shows every USB input device Rebind has claimed. Each card displays the device name, USB path, vendor ID, and type (Mouse or Keyboard). A green dot in the top-right corner of each card indicates the device is attached and active.
Attaching devices is done through the Auto Detect wizard. Click Auto Detect in the top-right corner.
Auto Detect wizard
Step 1 — Start
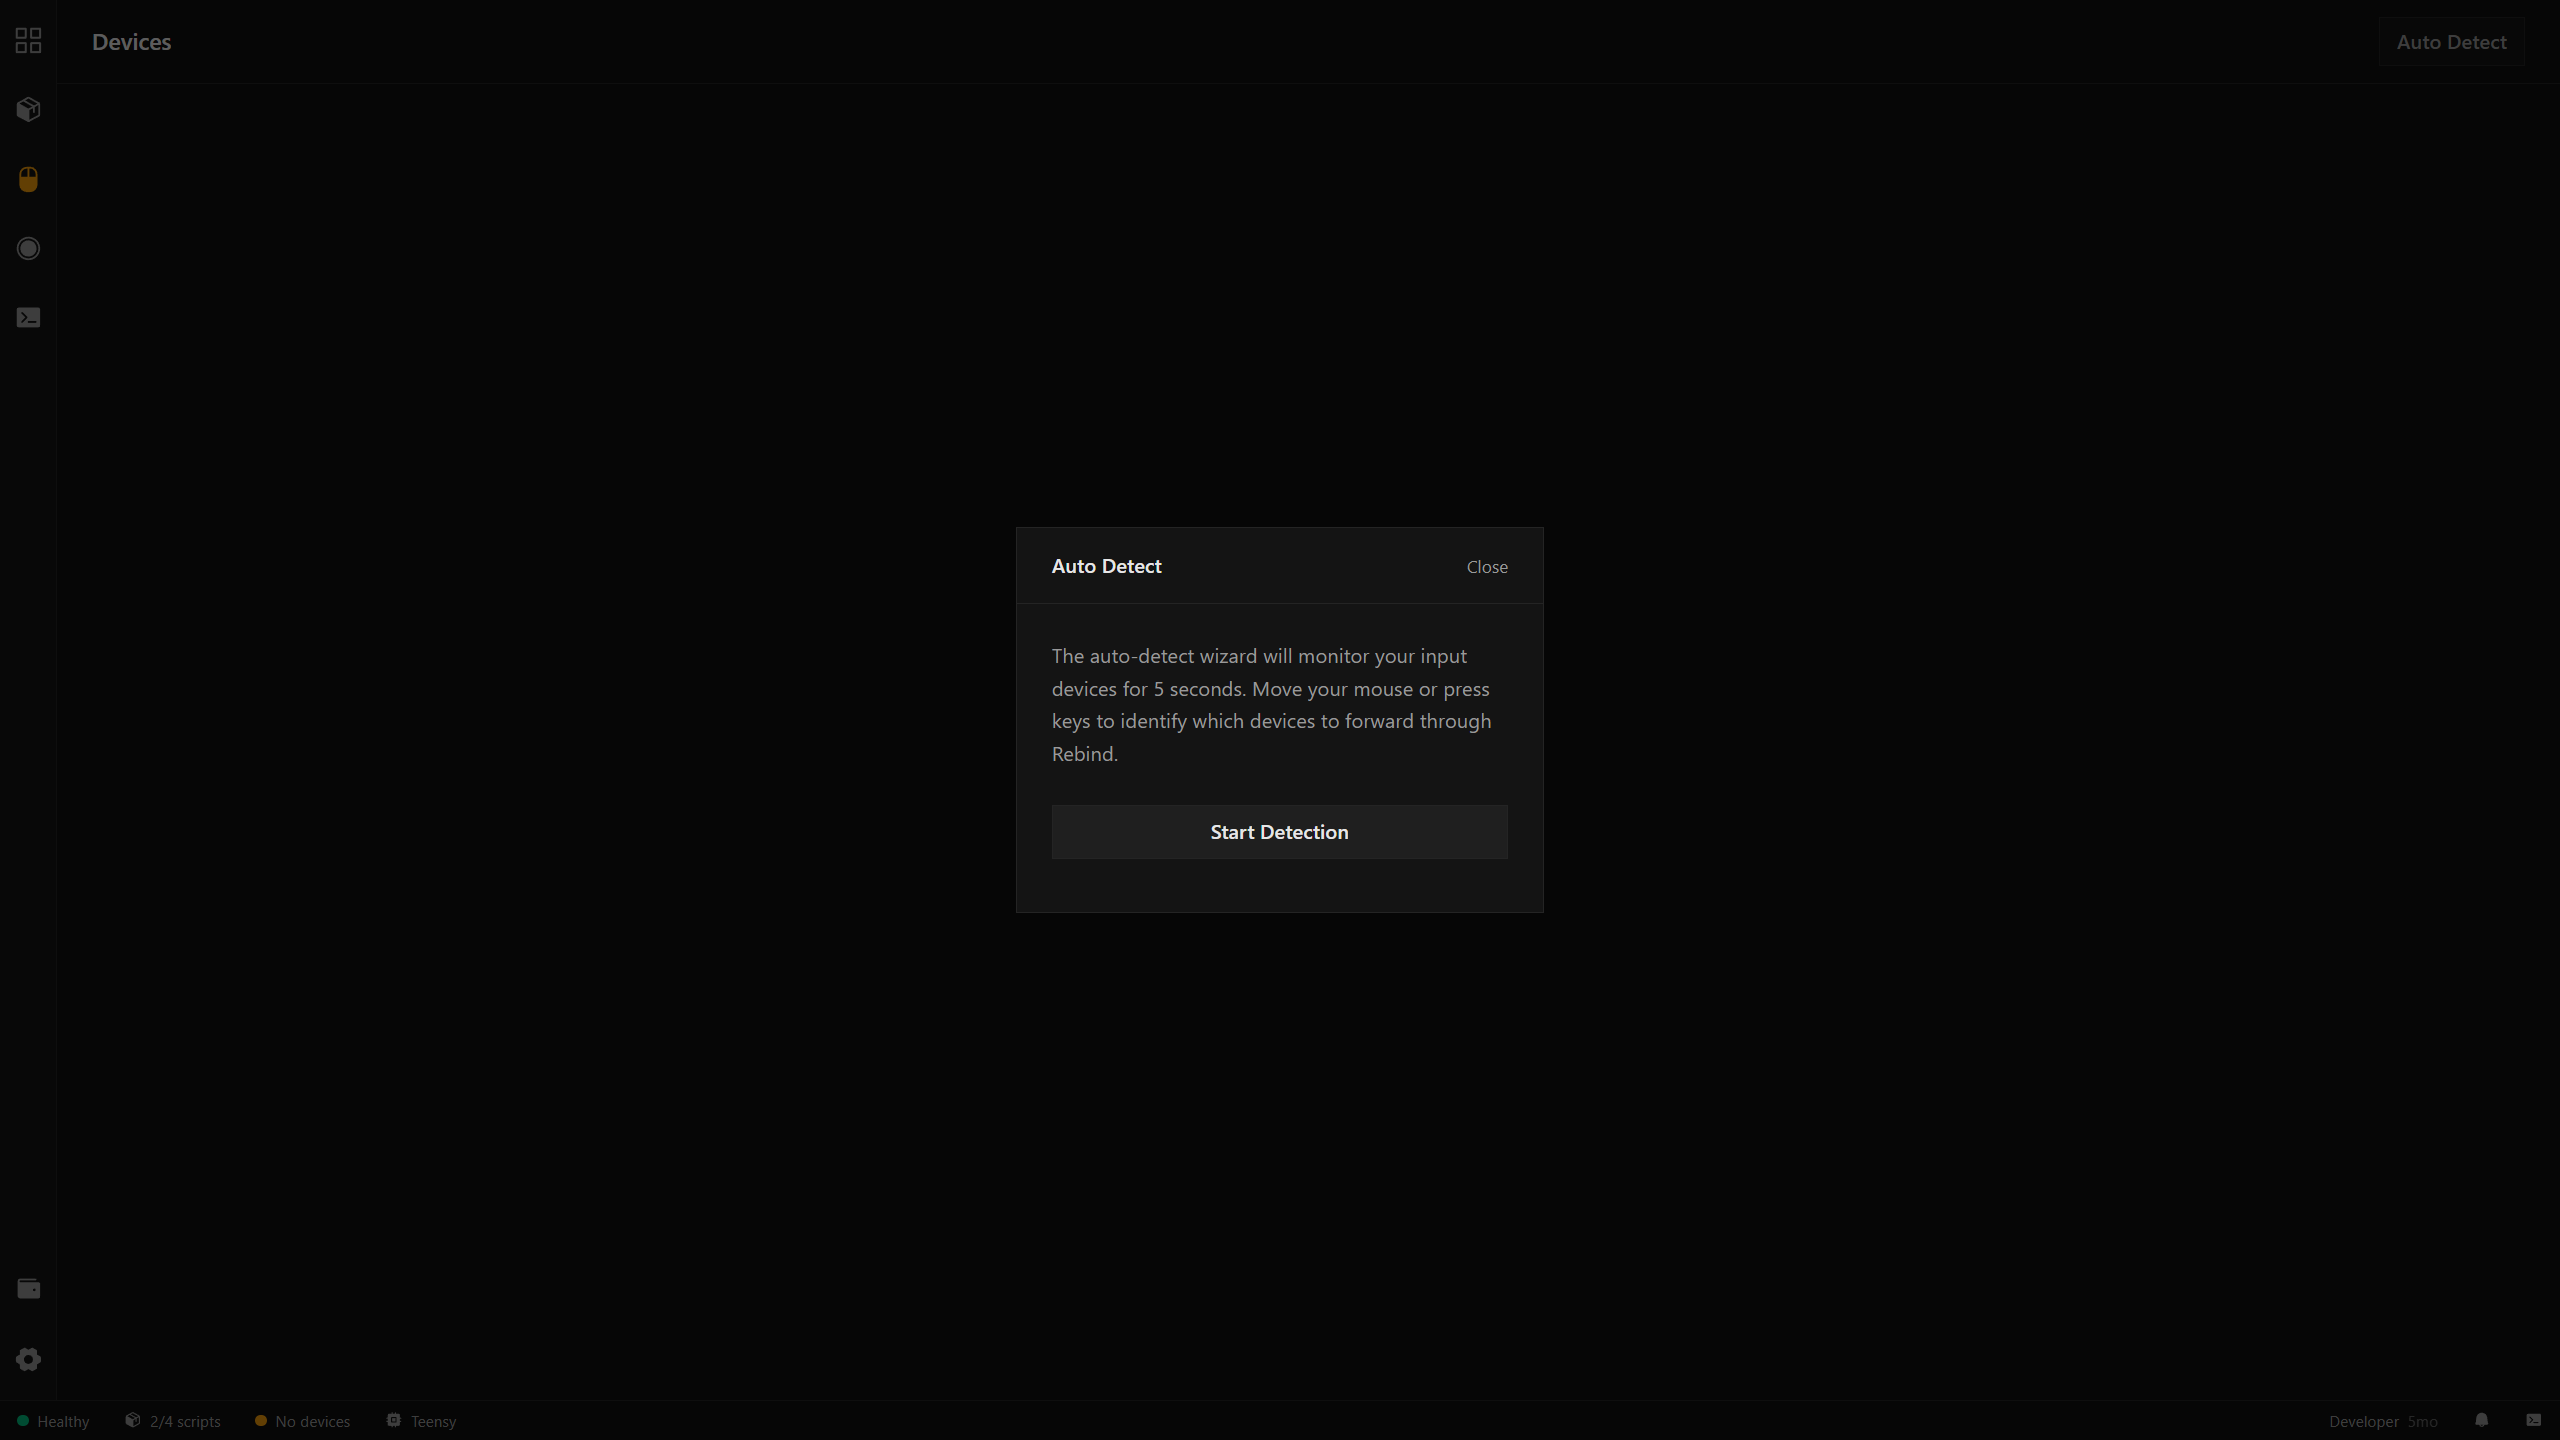
The wizard explains what it will do. Click Start Detection to begin.
Step 2 — Detecting
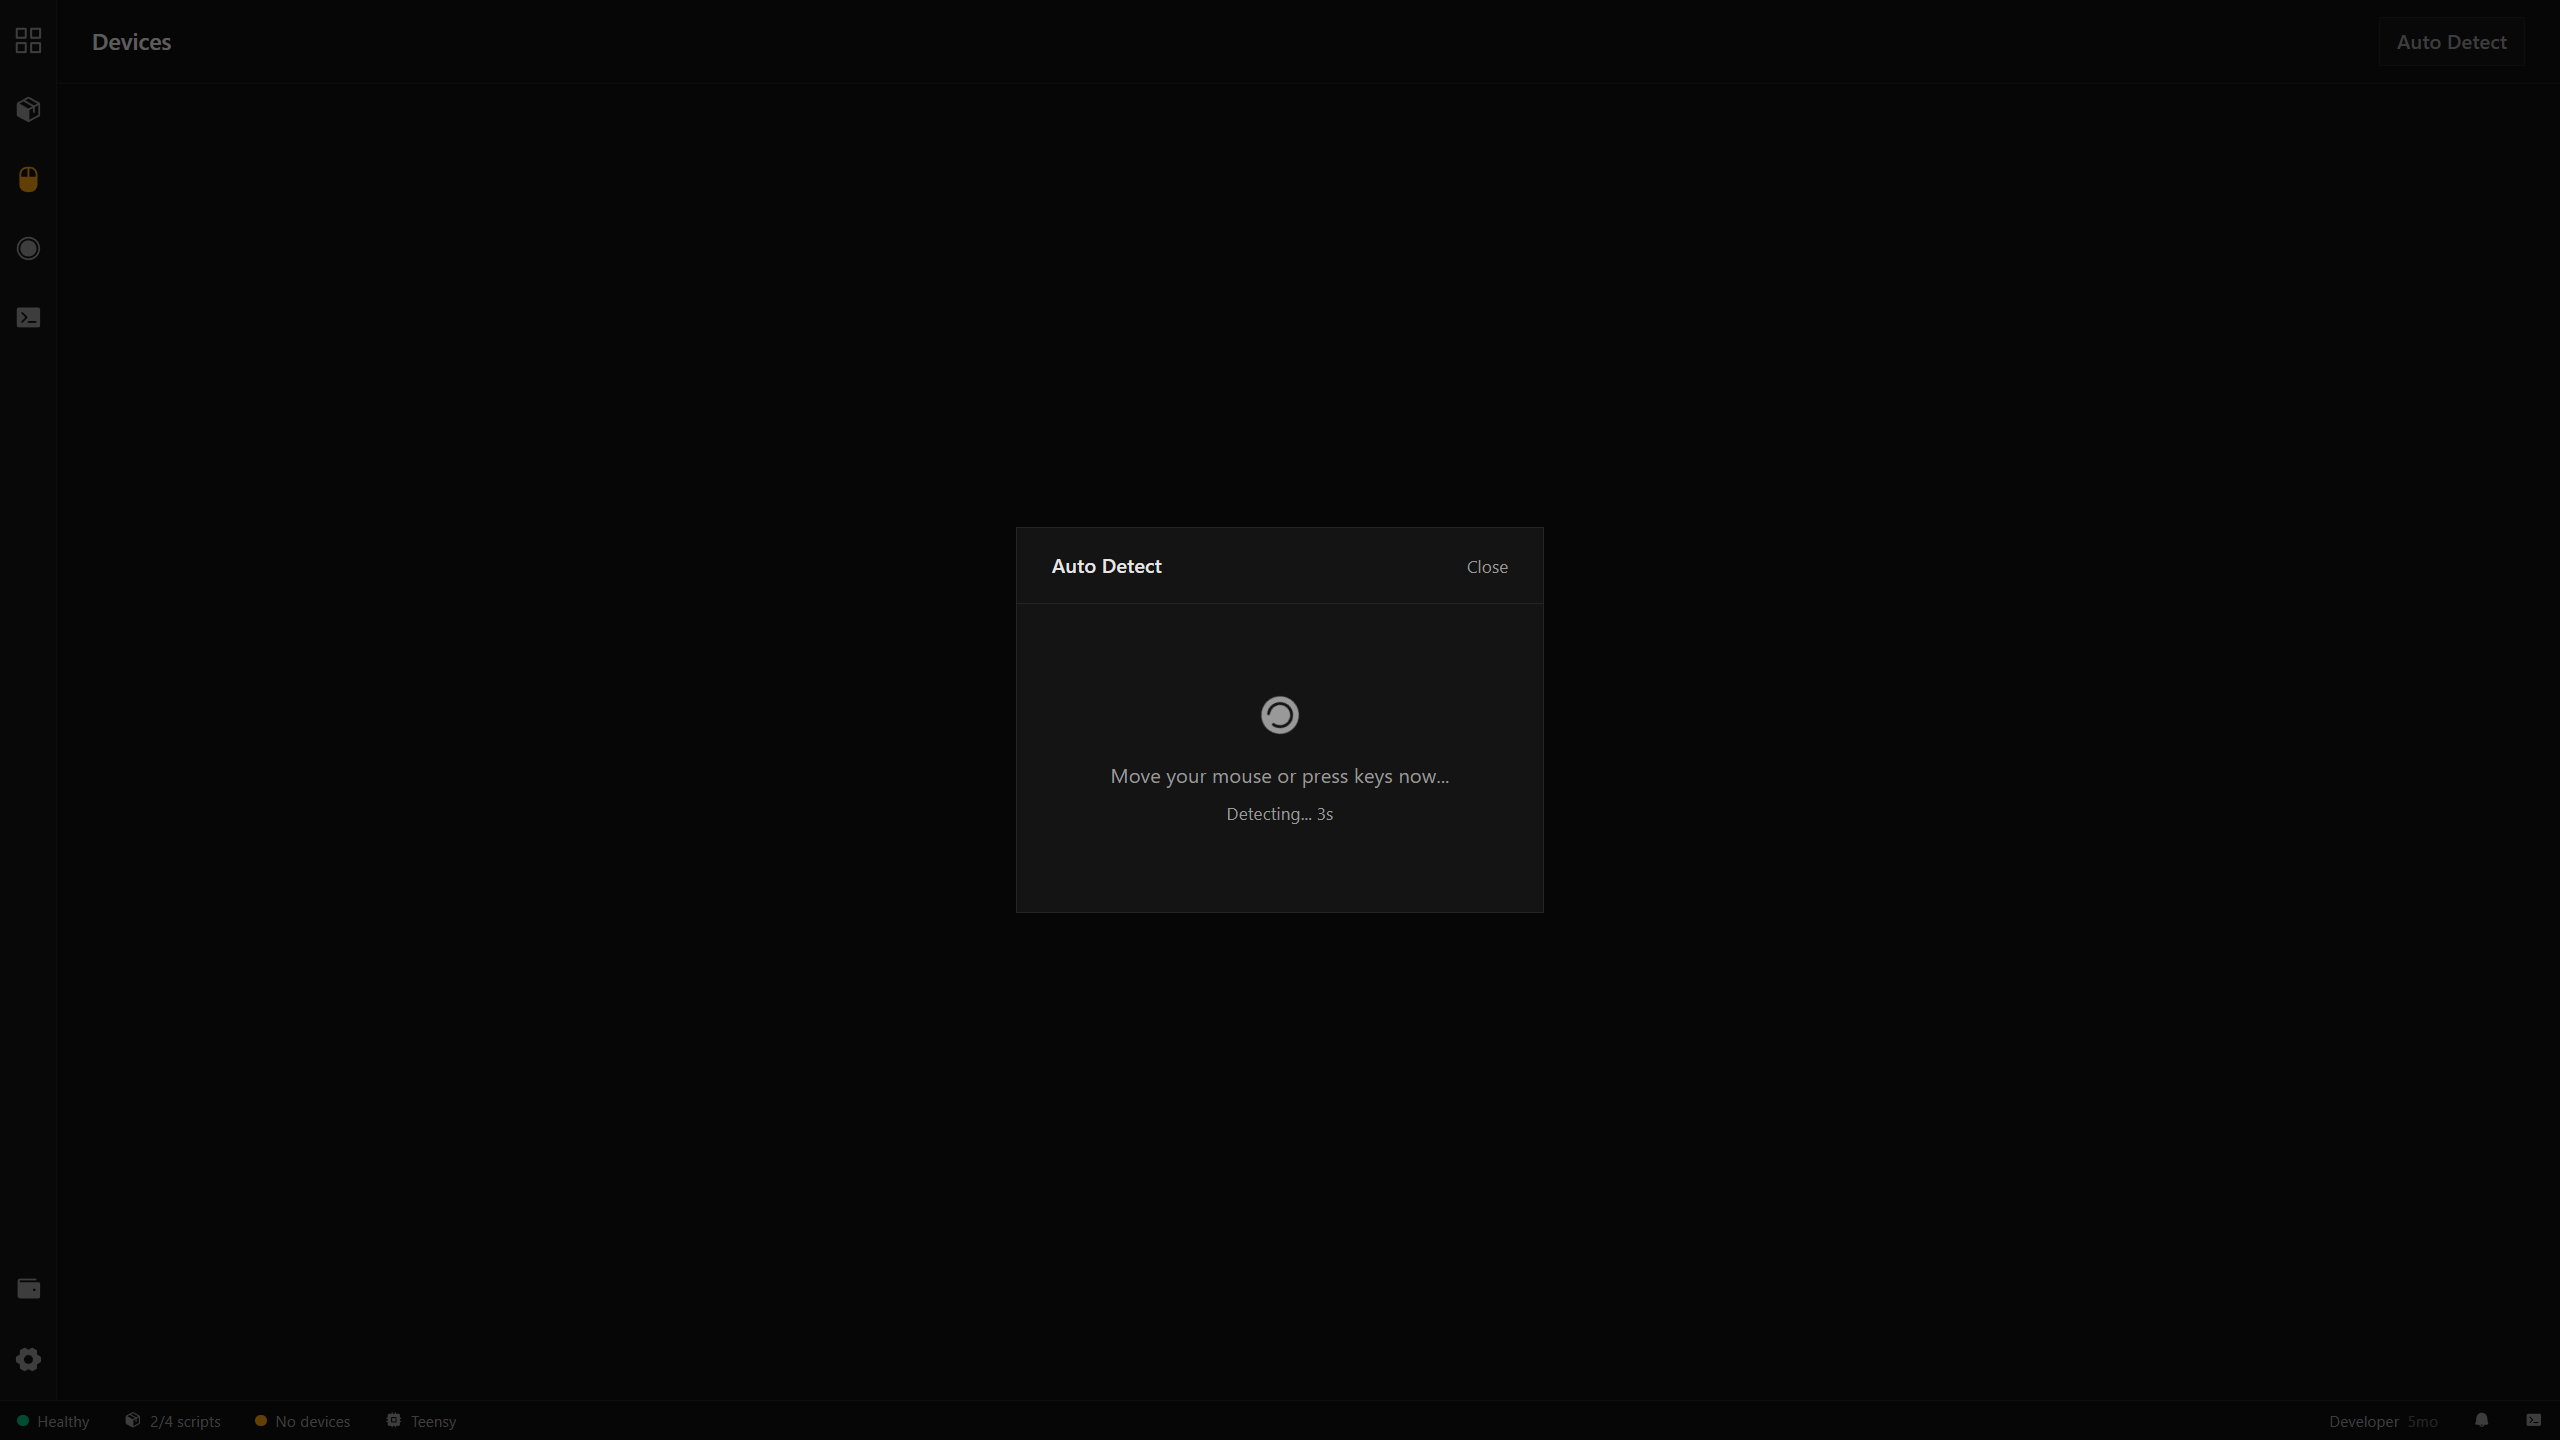
Rebind monitors raw input for 5 seconds. Move your mouse and press a few keys. The countdown is shown live.
Step 3 — Results
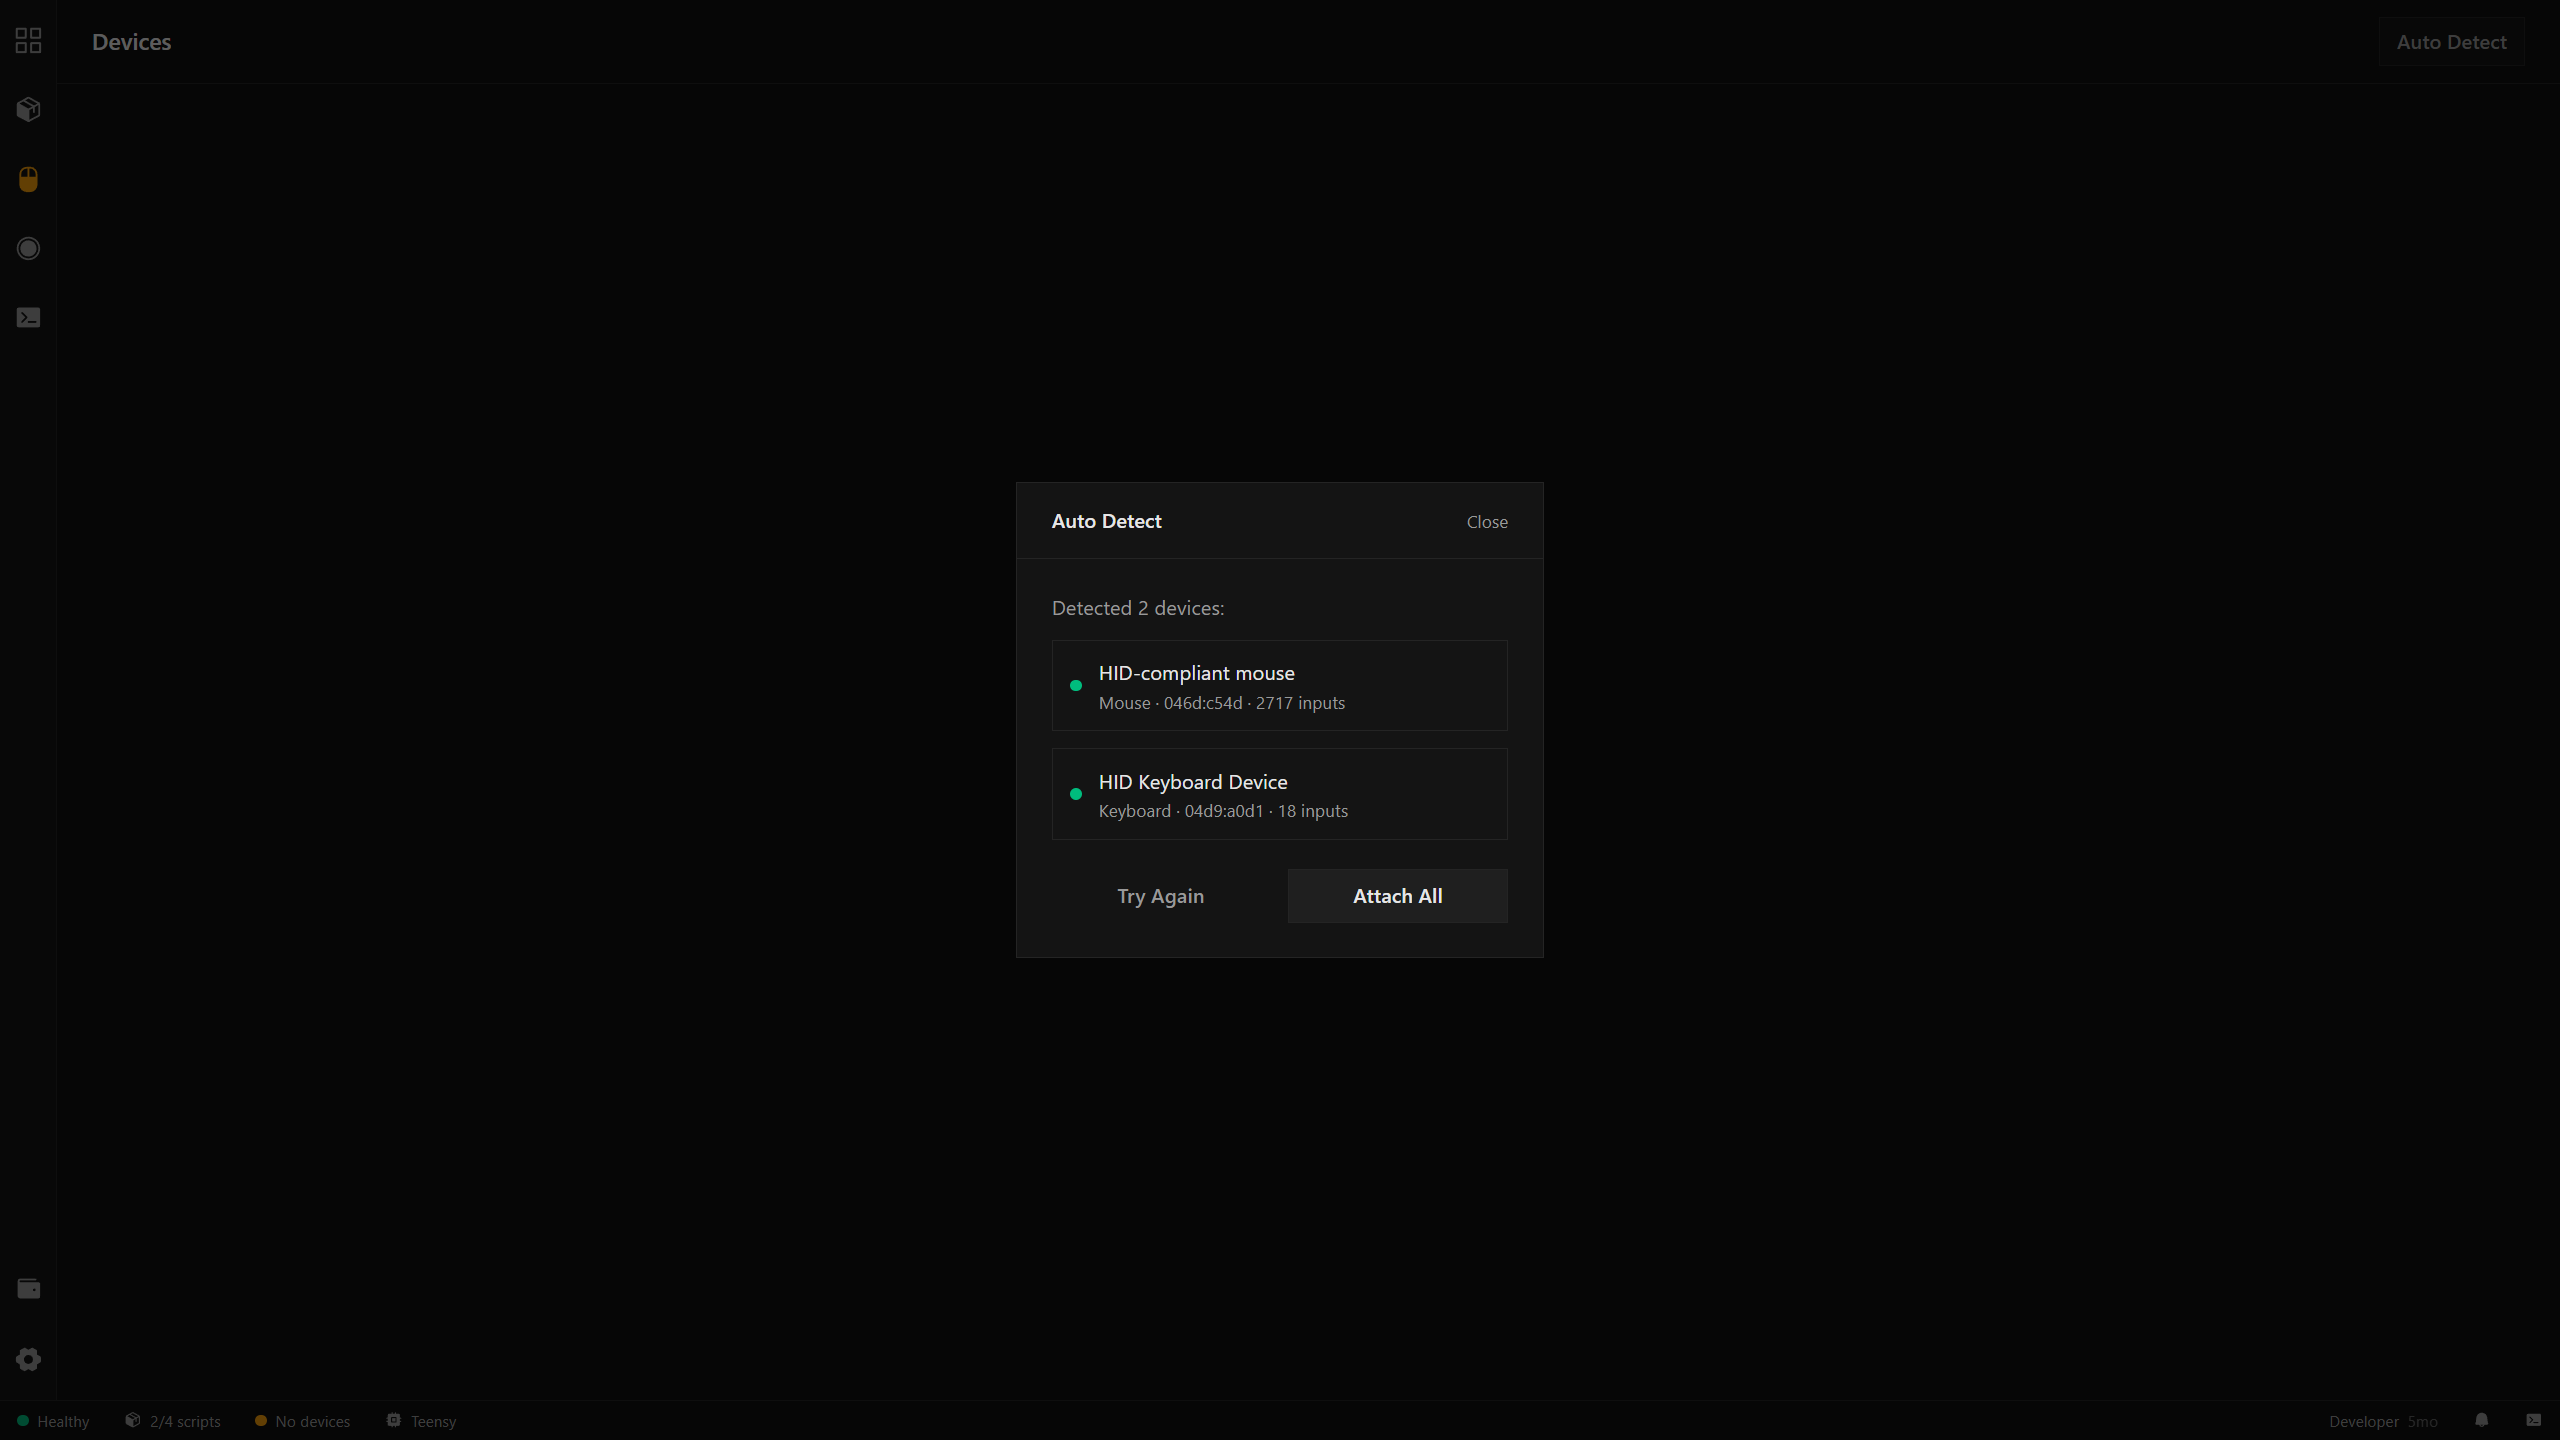
Detected devices are listed with their type, vendor ID, and input count. Click Attach All to capture all of them, or Try Again if something was missed.
Click Detach on any card to restore a device to normal operation immediately.
Macros
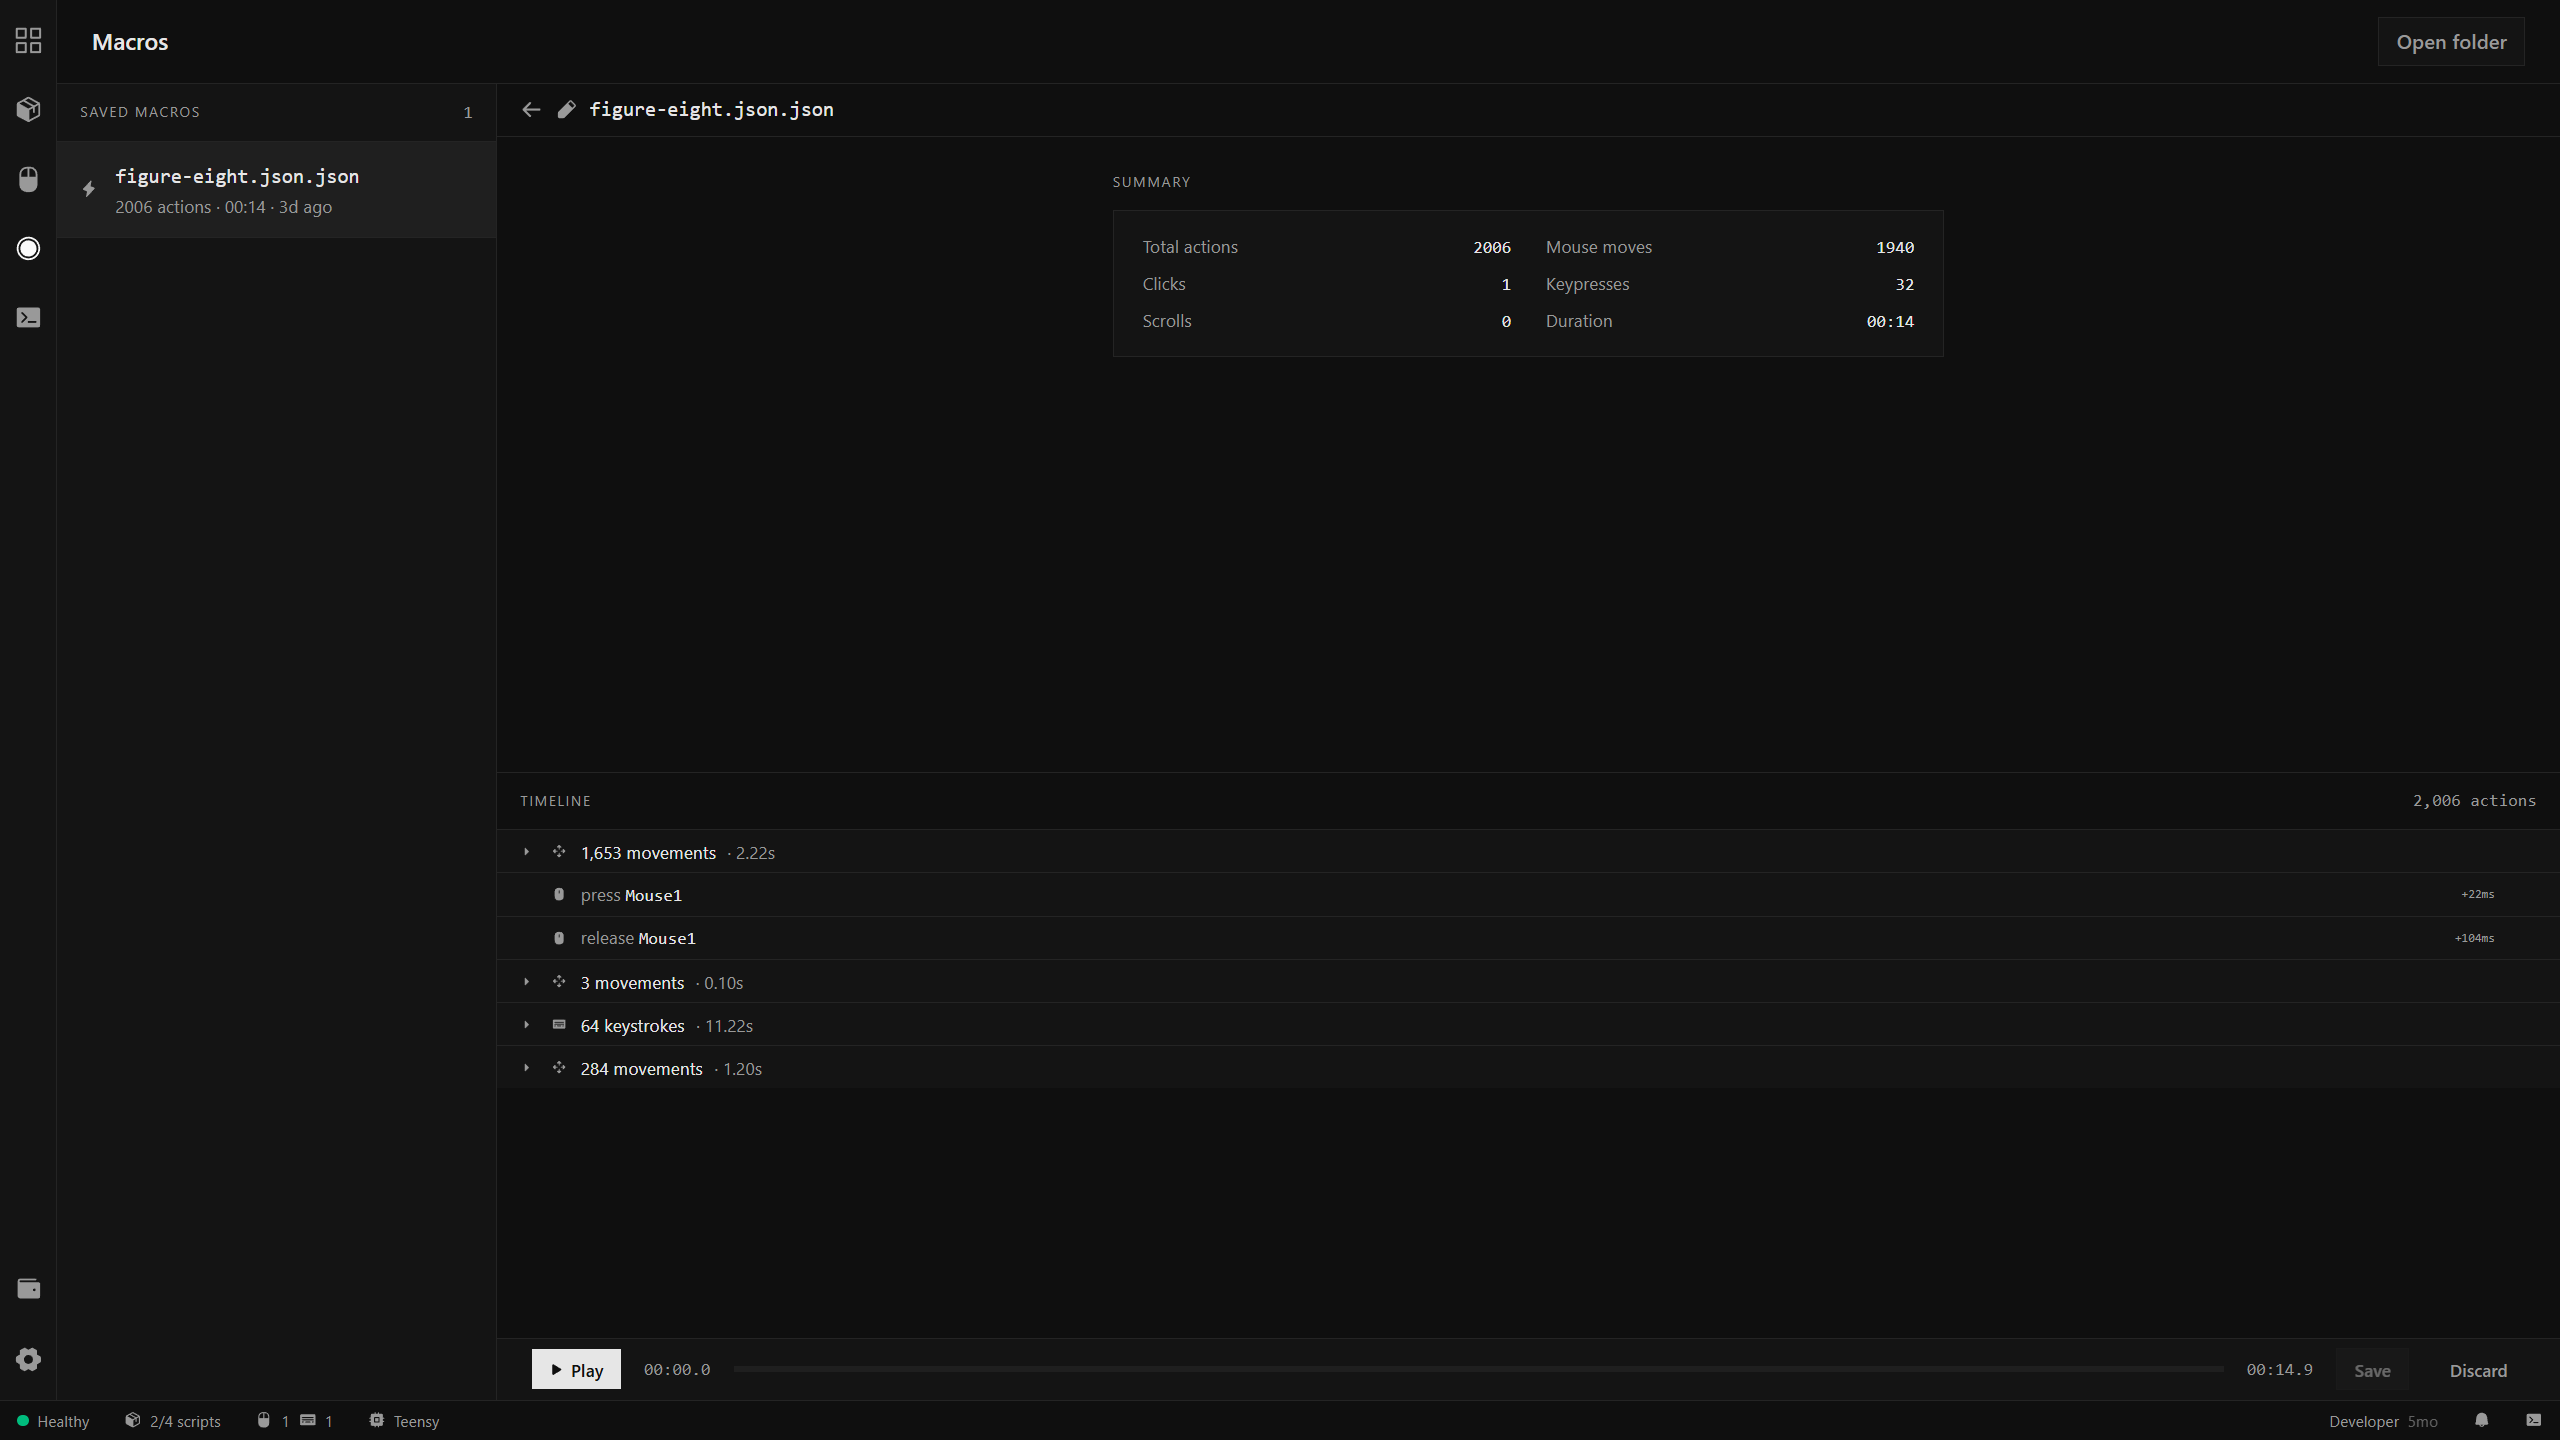
The Macros view is a library of recorded input sequences. The left panel lists saved macros with their action count, duration, and age.
Selecting a macro shows two panels:
Summary — total actions broken down by type: mouse moves, clicks, keypresses, scrolls, and total duration.
Timeline — the full action sequence grouped into runs of movements and individual key/button events. Each group shows its action count and duration. Groups can be expanded to inspect individual events.
The Play button at the bottom plays the macro once. A progress scrubber shows playback position. Save commits any edits; Discard reverts them.
To record a new macro, use Macro.StartRecord() and Macro.StopRecord() from a script, then Macro.Save(name) to persist it.
Logs
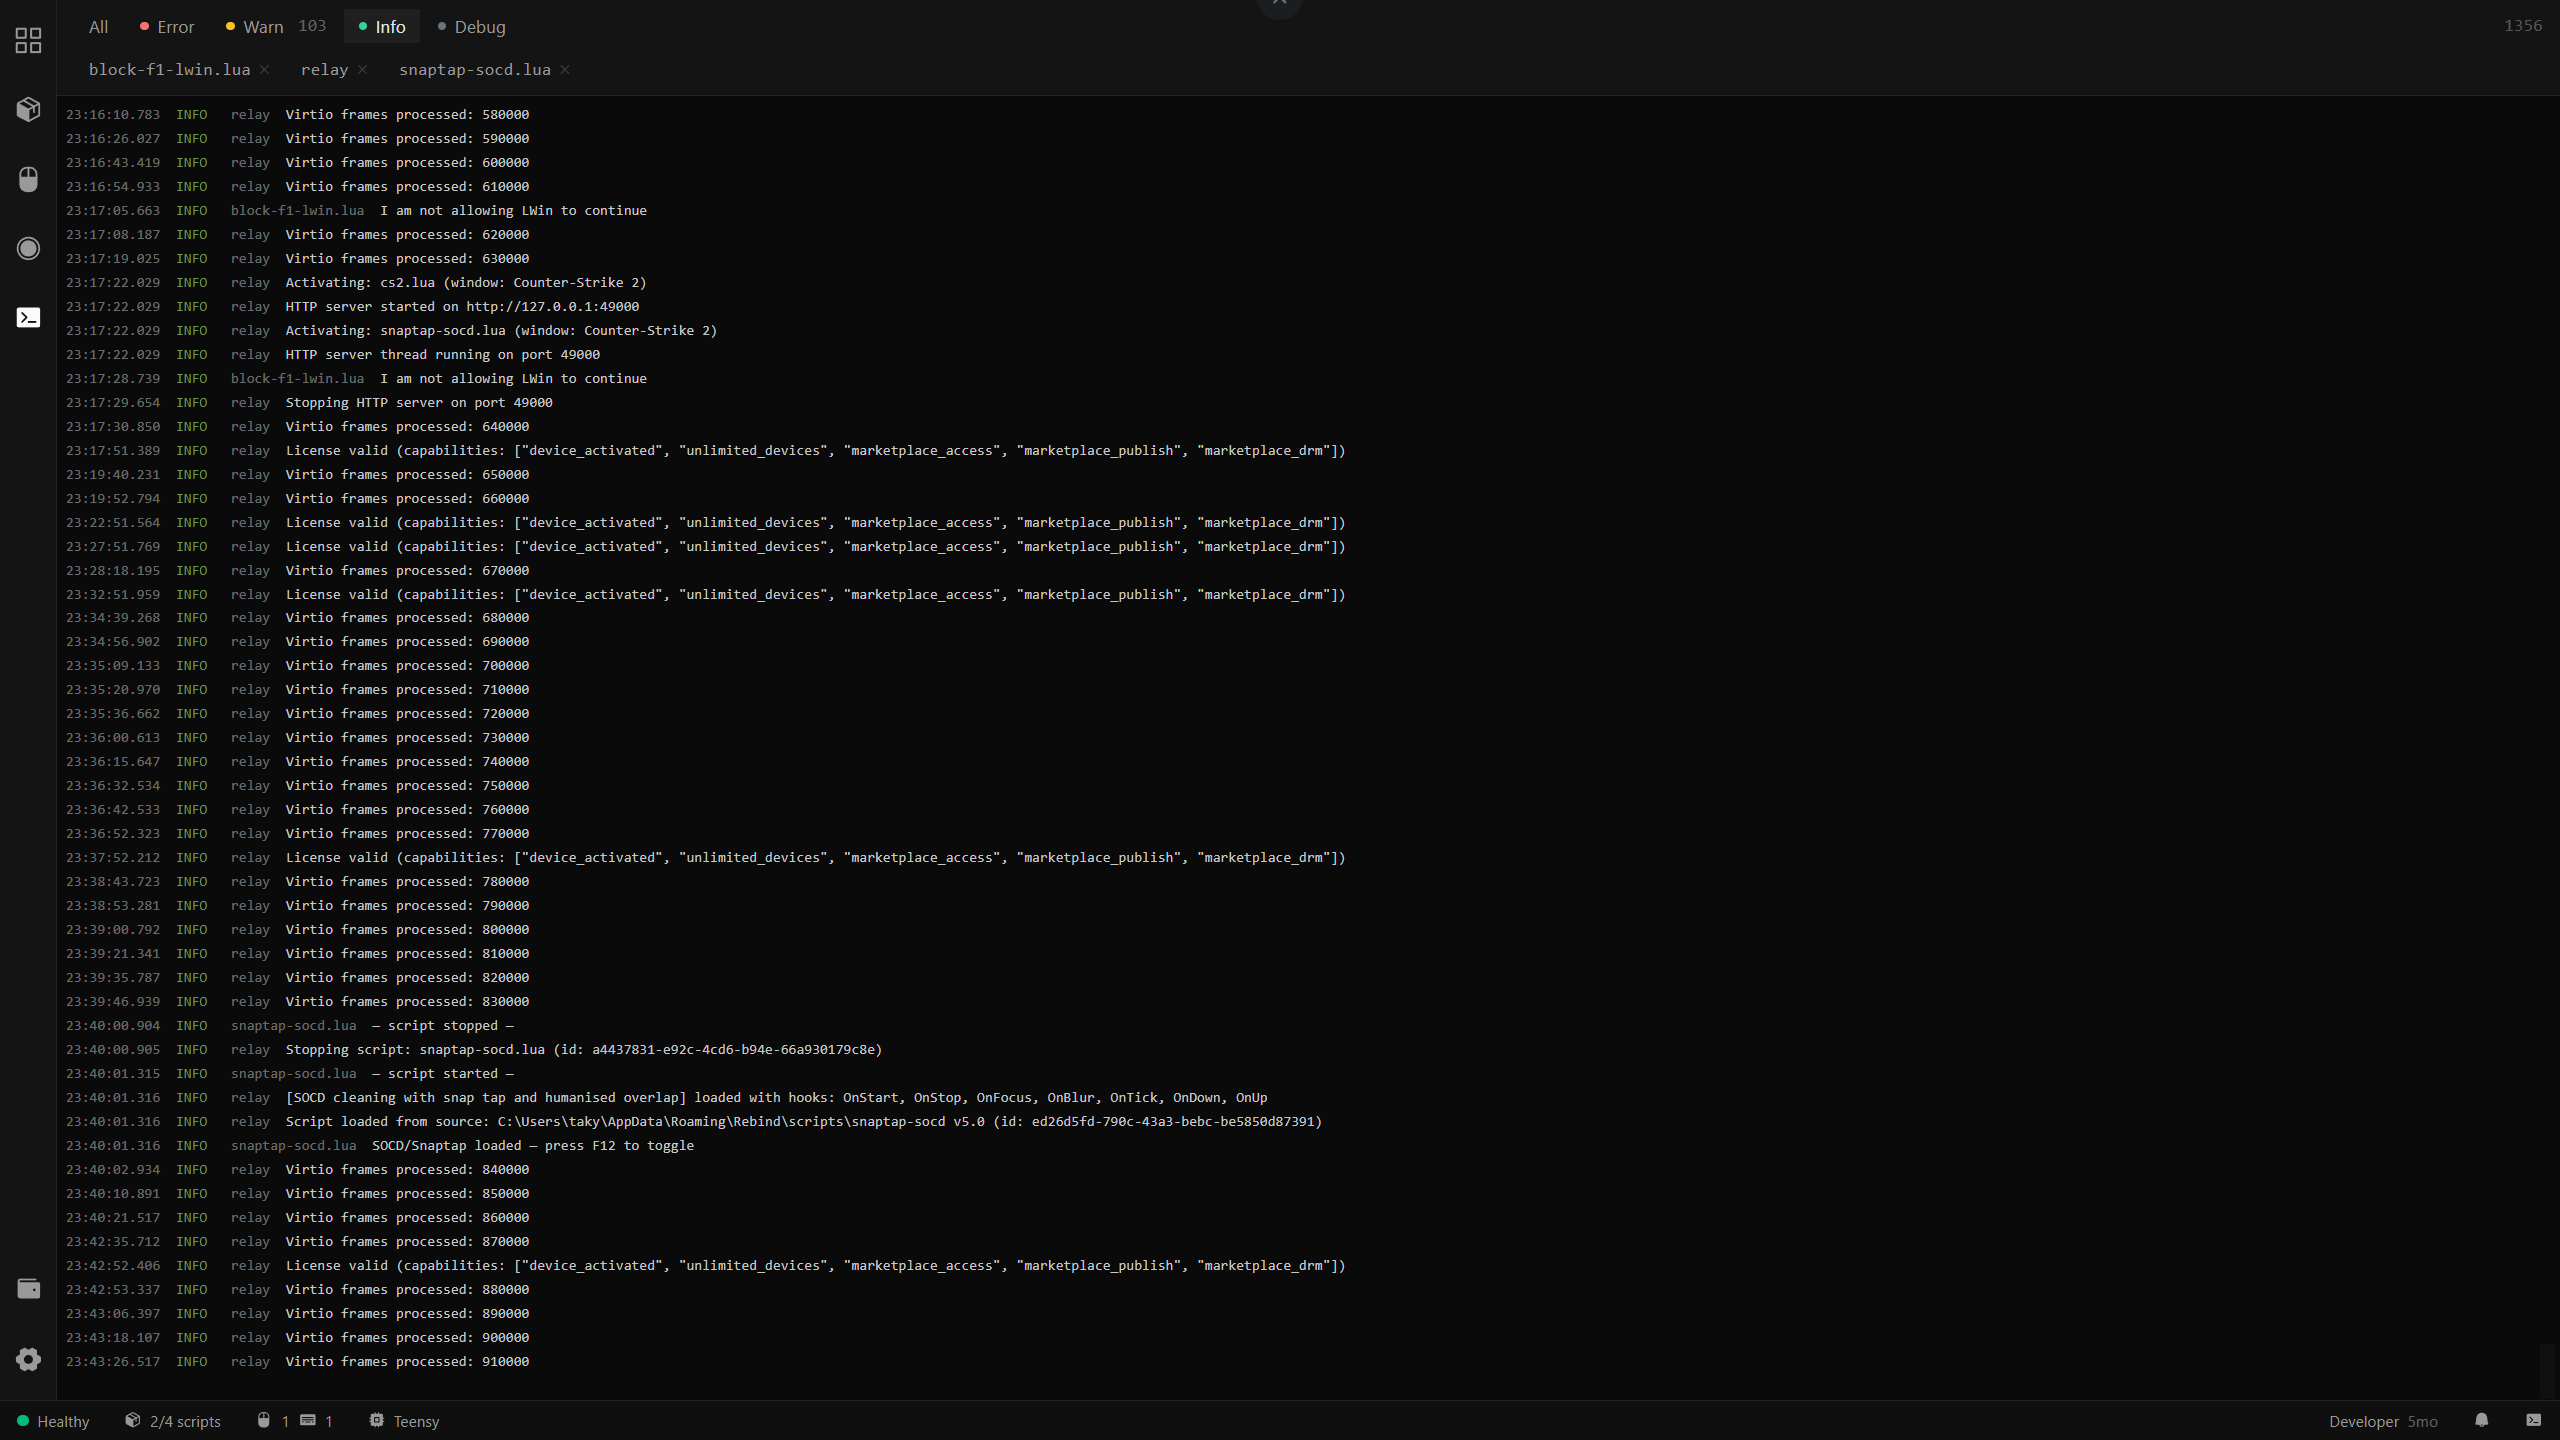
The Logs view is a live stream of all output from the relay, the Lua VM, and every running script. Log entries show a timestamp, level badge (INFO, WARN, ERROR, DEBUG), source (relay or script filename), and message.
Filter tabs at the top narrow by level. Source tabs below let you isolate output from specific scripts or the relay itself. The stream auto-scrolls; the entry count is shown in the top-right corner.
Log.Info, Log.Warn, Log.Error, log(), and print() all write here.
Settings
Settings is divided into two columns.
Left column:
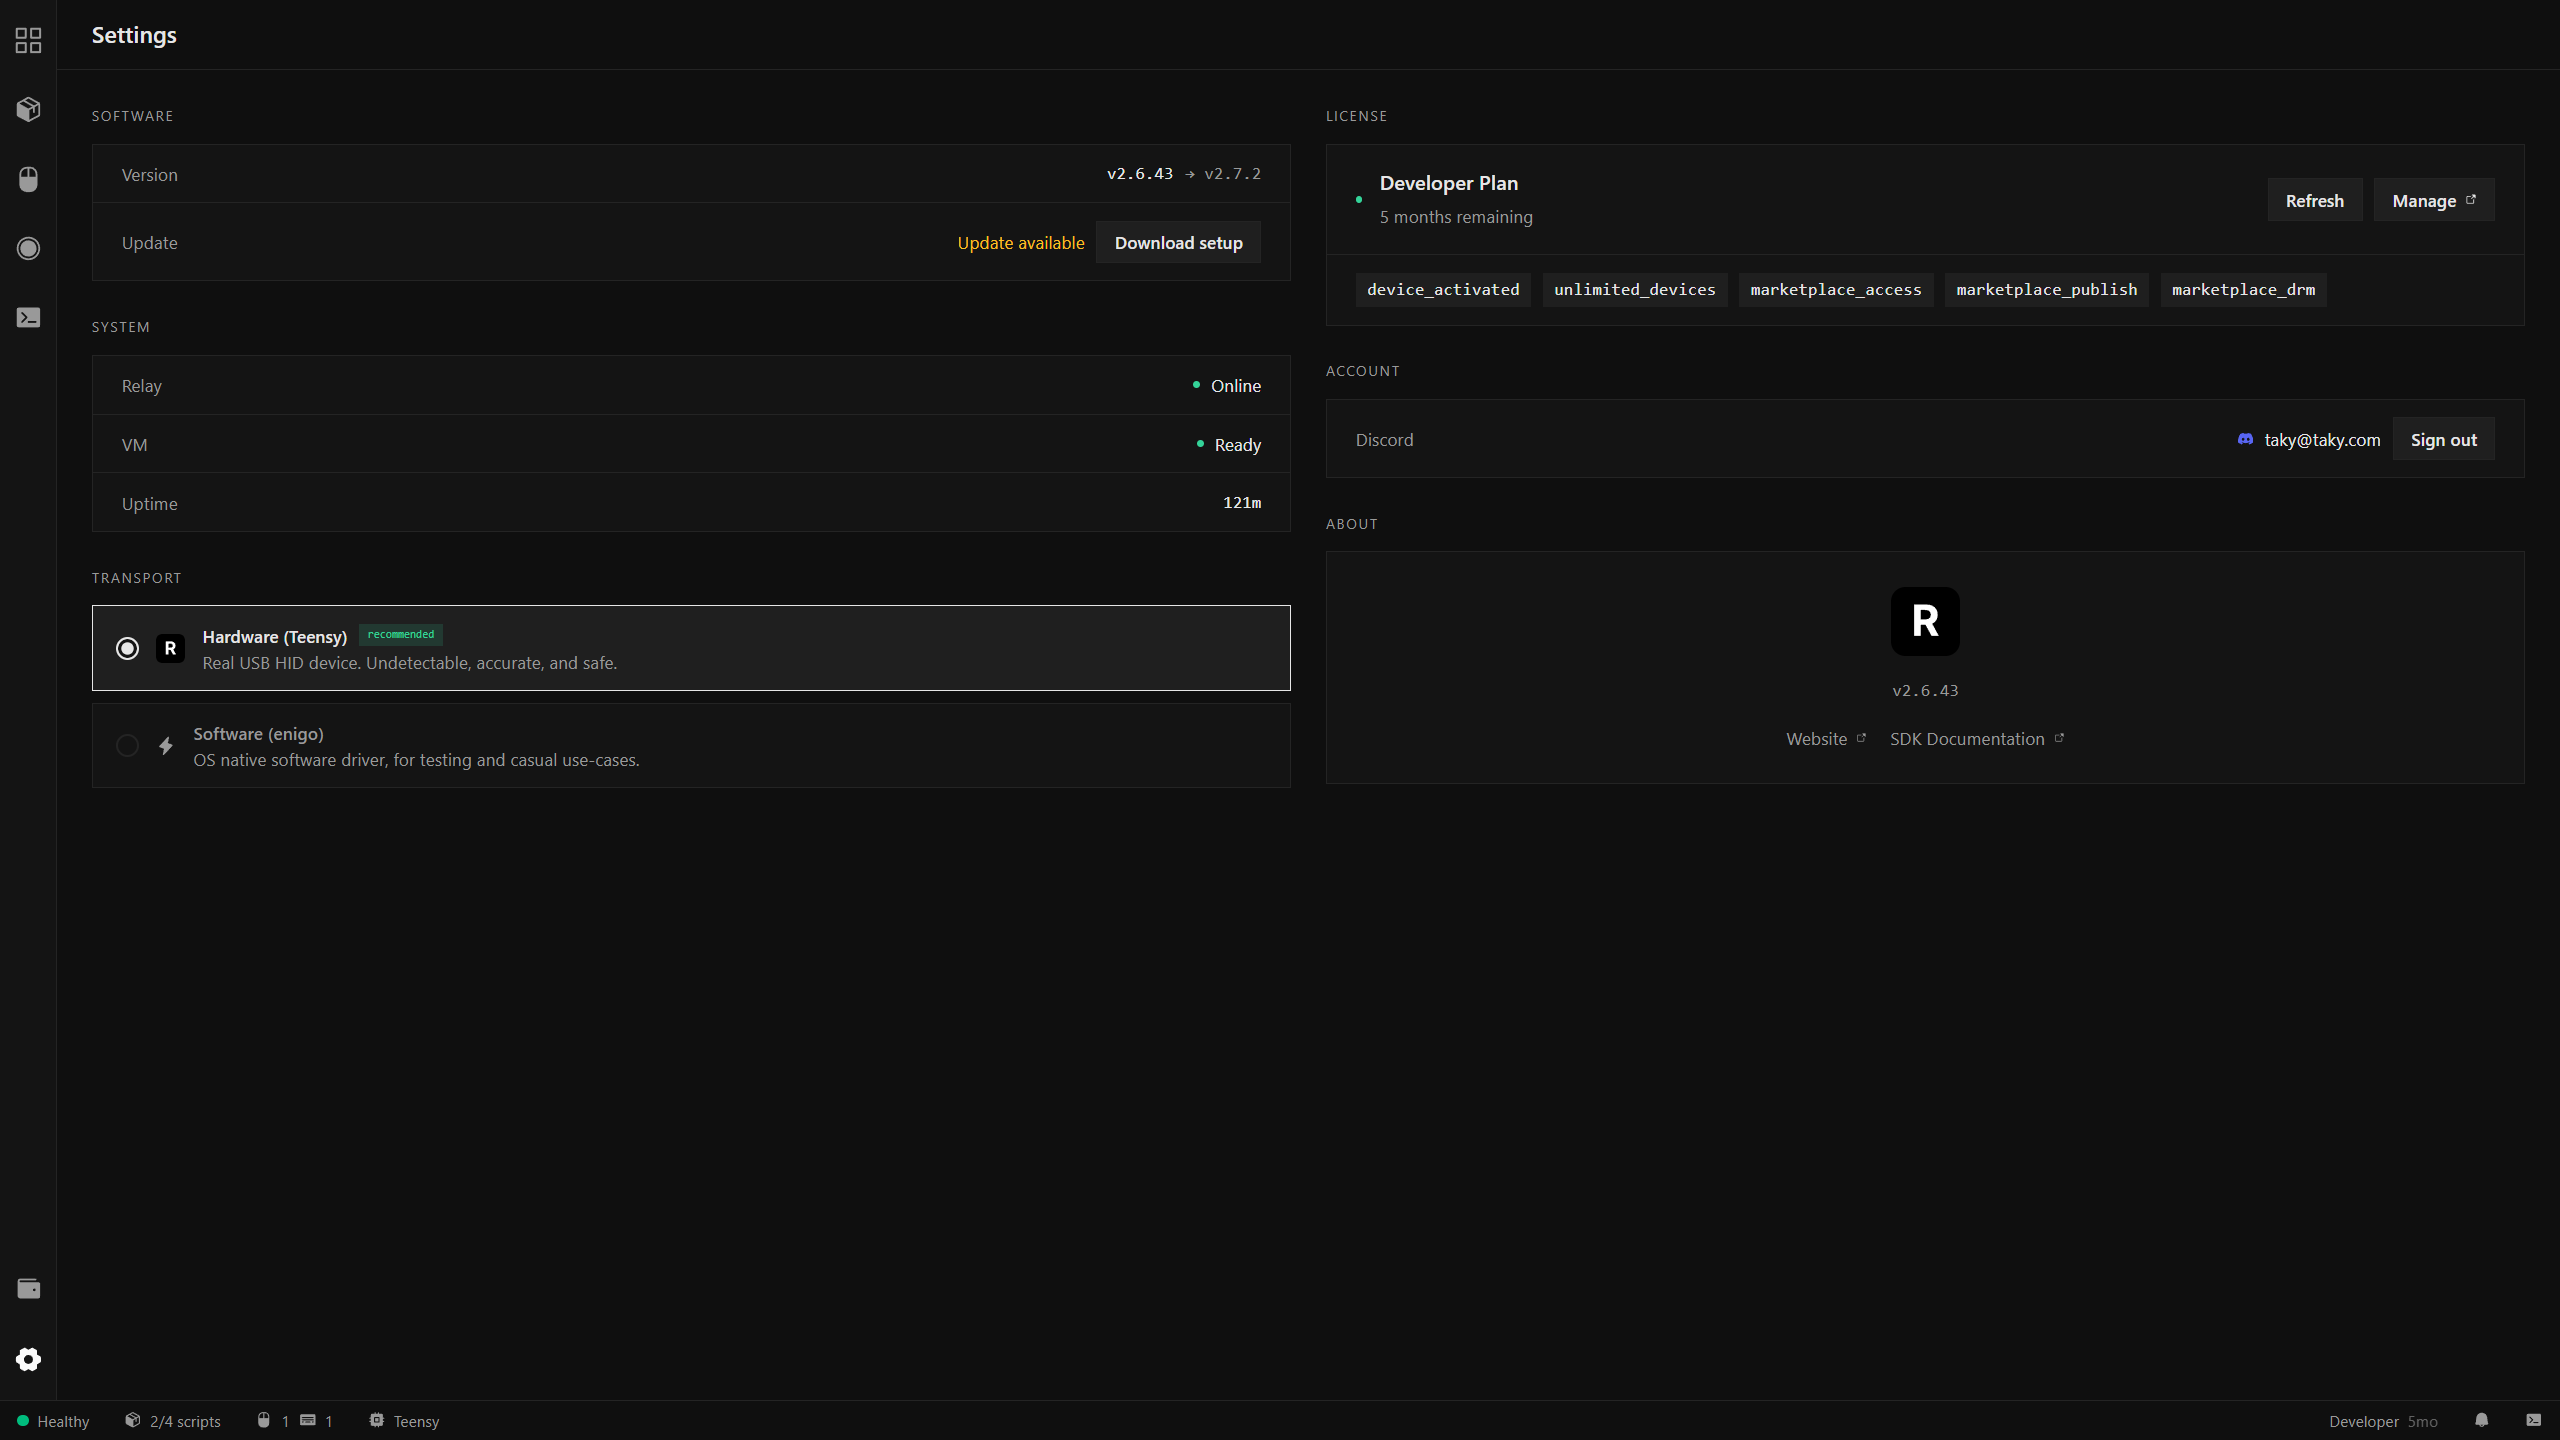
- Software — current version and available update. If an update is available, a Download setup button appears.
- System — relay status (Online/Offline), VM status (Ready/Error), and uptime.
- Transport — select between Hardware (Teensy) (real USB HID device, recommended) and Software (enigo) (OS-level driver, for testing without hardware).
Right column:
- License — plan name, time remaining, and the active capability badges (e.g.
device_activated,unlimited_devices,marketplace_access). Refresh re-validates the license; Manage opens the account portal. - Account — connected Discord account and a Sign out button.
- About — current version number with links to the website and SDK documentation.